|
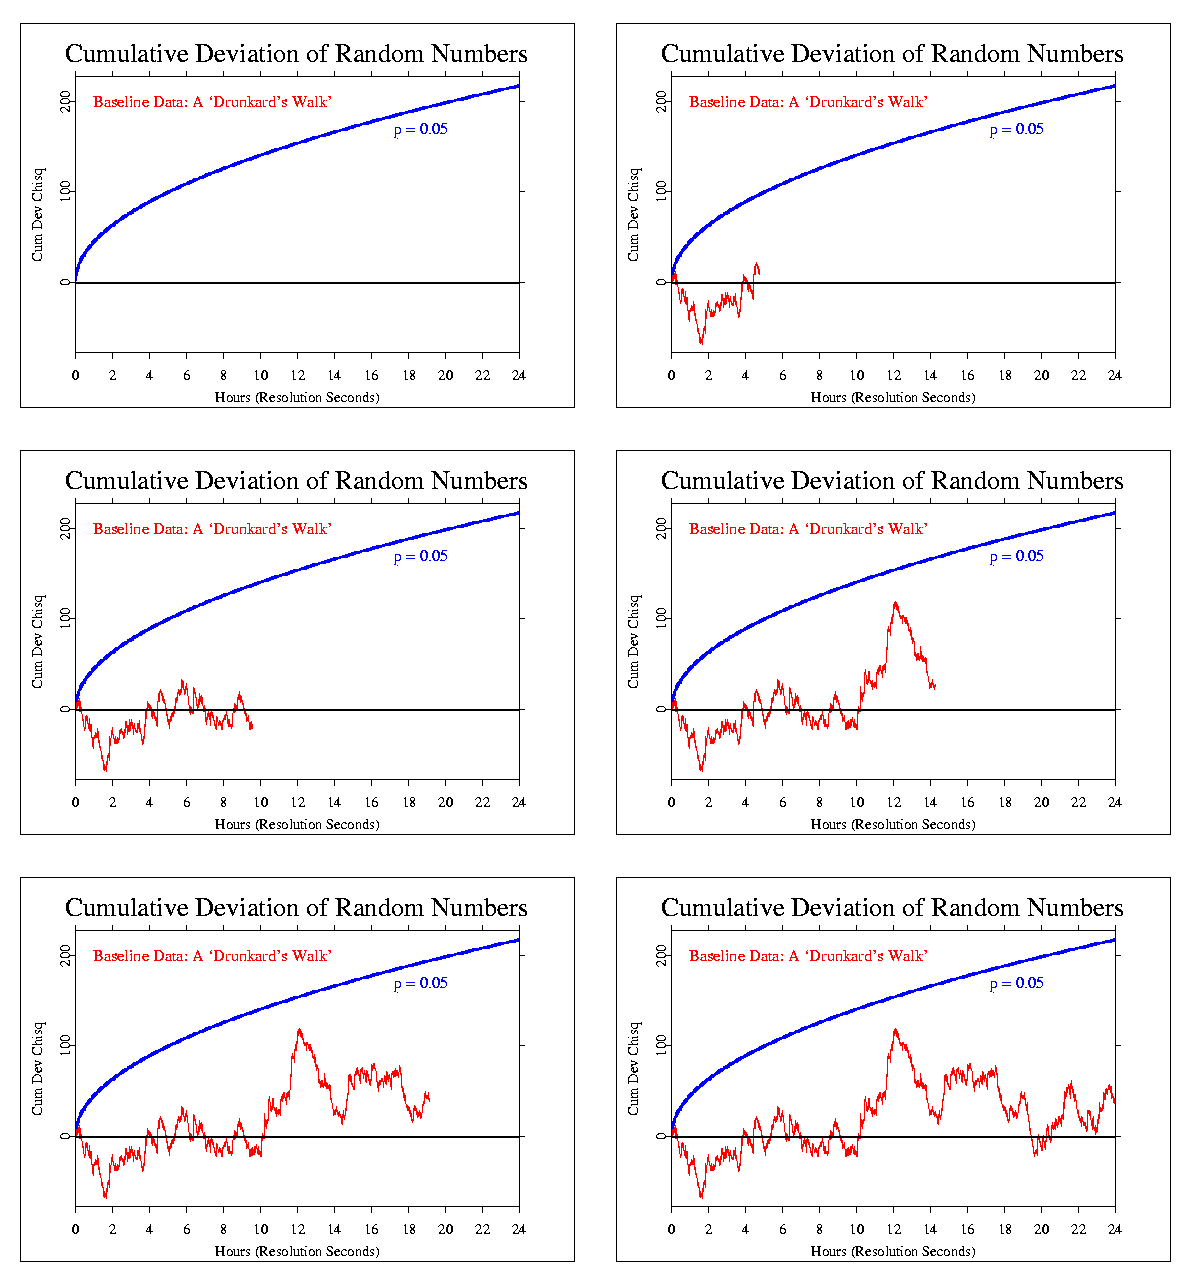
This figure shows a 24-hour random data sequence that is not
correlated with known major events in
the world. It is an example of a random walk, which may be likened to a
"drunkard's walk". The steps are unpredictable in length and direction,
so the trace wanders up and down around the mean value, but there is
no trend.
A blue probability envelope shows threshold for "significant" deviation.
The timing is set to show the 24-hour period in 15 or 20
seconds. But the display will be constrained by the speed of your processor.
Use your browser's back and forward buttons to replay.
Author: Greg Nelson, 19 Sept 2003

|