The Global Consciousness Project has allowed individuals access to its data so that they may
examine the data for themselves and even try some informal explorations of there own. There
have been such explorations into many social events and also explorations of geomagnetics,
stock market behavior etc.
James Spottiswoode published a paper showing that there appears to be a relationship between
the quality of extra sensory perception and the local sidereal time(LST). With this in mind I felt
it would be interesting to conduct my own informal exploration to see if effects outside our solar
system had an effect on GCP data. I had previously conducted some tests on LST effects on
GCP data, and have decided to revisit the data with some new insights.
Local sidereal time is used to give observers a reference point to find stars, galaxies etc. The
earth orbiting around the sun causes seasons to change, and it also is spinning around its own
axis creating the day/night cycle. As the earth rotates around the sun regular clocks are timed so
that the sun will be overhead at the same time each day. This means that due to the orbiting
around the sun that the earth will not have the same stars directly overhead. The result is that a
sidereal day is shorter then a solar day by around 4 minutes. This means that if you record the
sidereal time at noon solar time and then check it at noon solar time one month later the sidereal
clock will be two hours ahead of what it was a month ago.
This is the second time I have looked for local sidereal time (LST) based influences on the GCP
data. My first exploration made some assumptions that may have weakened the effect, and also
ignored some fundamental issues involving what was being looked at. I had initially looked at
only two years of data, and had lumped the data into two groups: Northern and Southern
hemispheres. If there is a galactic effect related to either the galactic center or to the angle
relative to the galactic axis it would be much preferred to take the actual angle from each
generator to the influence source rather then simply lump generators at different latitudes
together based only on local sidereal time. The angles are formed by finding the three
dimensional angle between the observer [right ascension(LST) and declination(latitude)] and the
source [right ascension and declination]. The angles to the galactic center and the galactic axis
will change dramatically for observers at the same LST but at different latitudes. Here are three
graphs illustrating the differences for +45, 0 and -45 degree declinations (latitude).
If there is a source of influence that is not related to the previous two galactic elements it may be
found by making a star chart with the x axis consisting of right ascension(LST), the y axis
consisting of declination(latitude) and filled with colors based on the results of the tests Z-score
for each point.
The GCP data consists of 1 second samples of 200 random bits with each bit having a
probability of 0.5. Therefore the theoretical mean will be 100, and the theoretical standard
deviation will be 7.071. For the purposes of this study I have taken each of these samples and
have converted them to a z score using the empirically determined standard deviation of the
samples generator. I then took two approaches to arrive at a testable value. First I square the z
score samples and add these products to find the variance. I then increment a count for keeping
track of the number of products (N) placed in that particular bin. The second approach was to
get the autocorrelation sum and N of the samples using lags from one to ten seconds. For each
type of test I added product data and then incremented the N count to one of 1440 bins based on
the individual generators LST in minutes. When all of the data had been placed in bins I saved
the bins to a file for use latter in making a star chart like graph. I then made common bins that
all the generators would use and went through each generators LST minute bins and placed its
data in common bins according to degrees to galactic axis and then in bins according to degrees
to galactic center. I ran this procedure eight times, once for each year 1999-2006 and these
yearly common bins were then saved with the sum and N values so that the data could be
examined for the year or combined with data from other years.
The number of samples in the bins was very consistent for the LST minutes bins, however, the
number of samples in the degrees to galactic center and axis bins varies. Here are the values of
N for the variance measurement for the degrees to galactic center and axis bins.
Here are the graphs for the variance measurements with each point being the center of a 15
degree average window.
These are the graphs for the autocorrelation lag = 1 measurements with each point being the
center of a 15 degree average window.
There does not seem to be any large deviations from chance in the variance tests, but the
autocorrelation graph for degrees to galactic center seems to have an unusually negative slope.
The calculated slope using all available data points of the unaveraged data is -0.003924. I
generated 100 random slopes from random data of the same number of unaveraged samples used
to find the slope and found that indeed the slope is more negative then usual. The graph of the
results of this control test is presented here.
The graph for autocorrelation lag 1 also has two extreme values one positive and one negative
that are not surpassed in the same charts for lags 2 to 10, although one point in lag 8 comes
close. It is also very interesting that the negative most point is also the point closest to 180
degrees, and the positive most point is near zero degrees. Here are the simplified charts for the
autocorrelation lags 1 to 10 of the degree to galactic center charts.
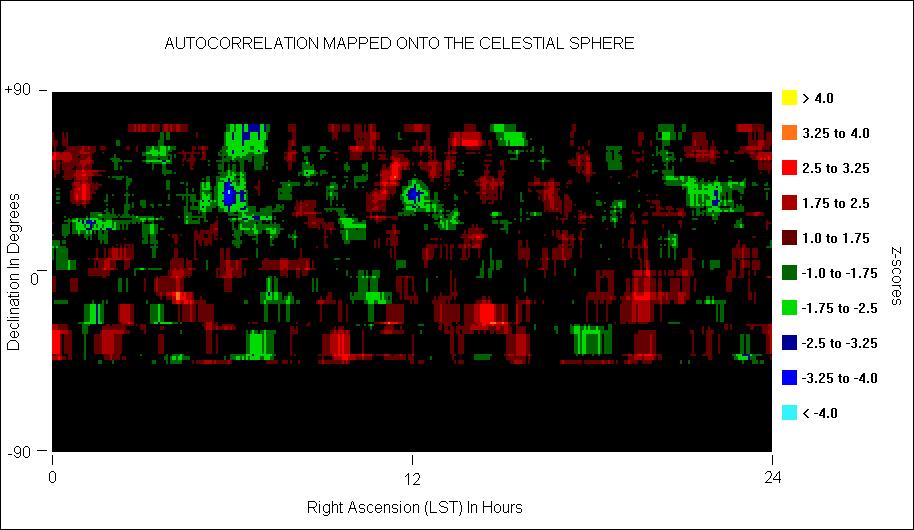
In order to test for other possible influences of Celestial origin I have created a sort of star chart
for each of the two test types. Each point is an average of 15 degrees in both the right ascension
and declination directions with the averages wrapping around the zero hour of right ascension.
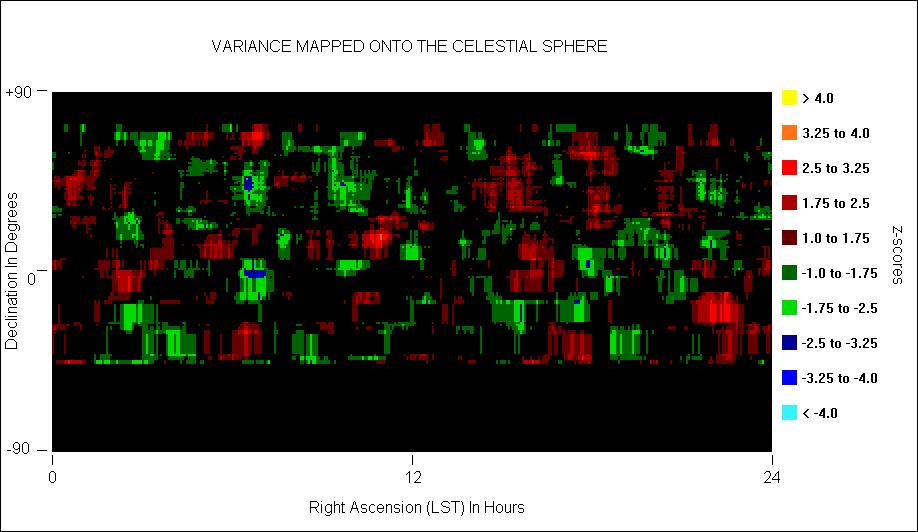
It must be stated that this was an exploration so a lot of different things could have been present
in the data that would have been considered interesting and that the findings reported must be
replicated. It should also be noted that there is a geometric relationship between the degrees to
galactic center and degrees to galactic axis. When the degrees to galactic center is at zero or at
180 degrees, the degrees to galactic axis will always be at 90 degrees so if there is an effect from
either it may show up the others data.
There does appear to be a pattern in the graph of autocorrelation (lag = 1) with respect to the
galactic center that suggests that something may be going on when the random number generator
is close to either the galactic center or is pointed 180 degrees from the galactic center. The
autocorrelation is a measure of how samples taken at different times are related. In this case I
tested for lags of 1 second to 10 seconds. If the samples are completely random there should be
no relation between the two and the autocorrelation would be near zero. If for some reason there
is a relationship between the two then a positive value of autocorrelation would indicate that
something was causing the signals to be more similar to each other and a negative value would
mean something was making them more dissimilar. In the graph it appears that when a
generator is pointed very near the galactic center the samples one second apart have elevated
autocorrelations, therefore they are unusually similar to each other. When a generator is pointed
near 180 degrees away from the galactic center the opposite happens and the one second apart
samples are unusually dissimilar.
If the pattern in autocorrelation repeats itself over the next few years it will interesting to see
what could cause the random samples to have unusually high similarity with their previous
sample when pointed at the galactic center, and unusually low similarity with their previous
sample when pointed 180 degrees away. If there were some source at the galactic center
affecting randomness and if the earth were only shielding the source then you would not expect
to find a negative autocorrelation 180 degrees away from it.
Send correspondence to Mike Meyer