Odds Ratios for Long Term Network Variance
Here we look at odds ratios for the cumulative deviations in the network variance measure applied to GCP data. We examine the full database of more than a decade of data, asking whether this statistic shows trends over time. It may not be possible to identify the reason
for any unusual spikes, but the exercise may stimulate other useful questions.
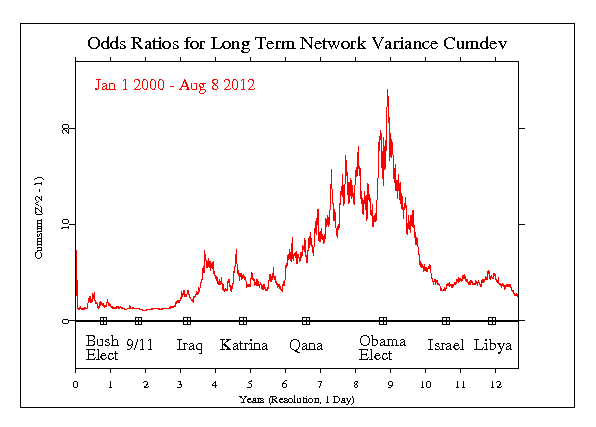
The figure below shows the period from January 1, 2000 to August 8, 2012, almost 13 years of data. First, the data are processed in the same way we analyse most individual formal events. It is a comprehensive view, however, literally assessing the full history of data collected by the GCP.
We begin the calculation with the squared Stouffer’s Z-score across all eggs each second, referred to as the network variance. The data are compressed so each point represents one day. Then the cumulative sum of this measure is taken, and finally we calculate the odds ratio for each point in the cumulative trace. This yields an estimate for the momentary (daily) odds of so large a deviation as is found.
The figure shows only modest deviations in the early years, but beginning in 2003, the odds ratios steadily increase until they peak toward the end of 2008. There is a steady drop over the next few months and the trend levels out for the next 2 or 3 years.
Some points are marked on the horizontal zero line which are the dates of a selection of events that were subjects of formal analysis. The trends in this 12 year figure correspond largely to the US presidential tenures of George Bush and Barack Obama. We should not conclude there is a causal relationship, but the coincidence does symbolize a worldwide perspective on the US presence in global affairs.
A separate analysis of Network Variance trends in the long term data presents another interesting view of the full database.

It is important to keep in mind that we have only a tiny statistical effect, so that it is always hard to distinguish signal from noise. This means that every "success" might be largely driven by chance, and every "null" might include a real signal overwhelmed by noise. In the long run, a real effect can be identified only by patiently accumulating replications of similar analyses.
